If your organization uses cargo-monitoring (supply-chain) devices (such as SC1204, SC1204S, SC1204V, SC1205V, and SC1302) and your user role has the Cargo Tracking privilege enabled, you will be able to view cargo-monitoring devices on the new Tracking screen. You can see where they are on the map and view important sensor details in the Device Details pane, including temperature, humidity, light, tilt, and shock data, as follows:
Note: If you are familiar with the Cargo Assets map layer from the legacy Tracking screen, you might be surprised to discover that this wasn't carried over to the new version of the page. Instead, you'll find your cargo-monitoring devices on the Fleet Assets layer along with all your vehicle assets (if any).
If you don't see your devices, your user role might not have the necessary permissions. Contact your organization's iOn administrator and request that you be given a role with Cargo Tracking rights.
Adding privileges to a role is explained in Editing a Role; the Cargo Tracking toggle is in the Tracking page area.
- Click
 on the left side of the screen.
- Click Tracking on the flyout menu that appears.
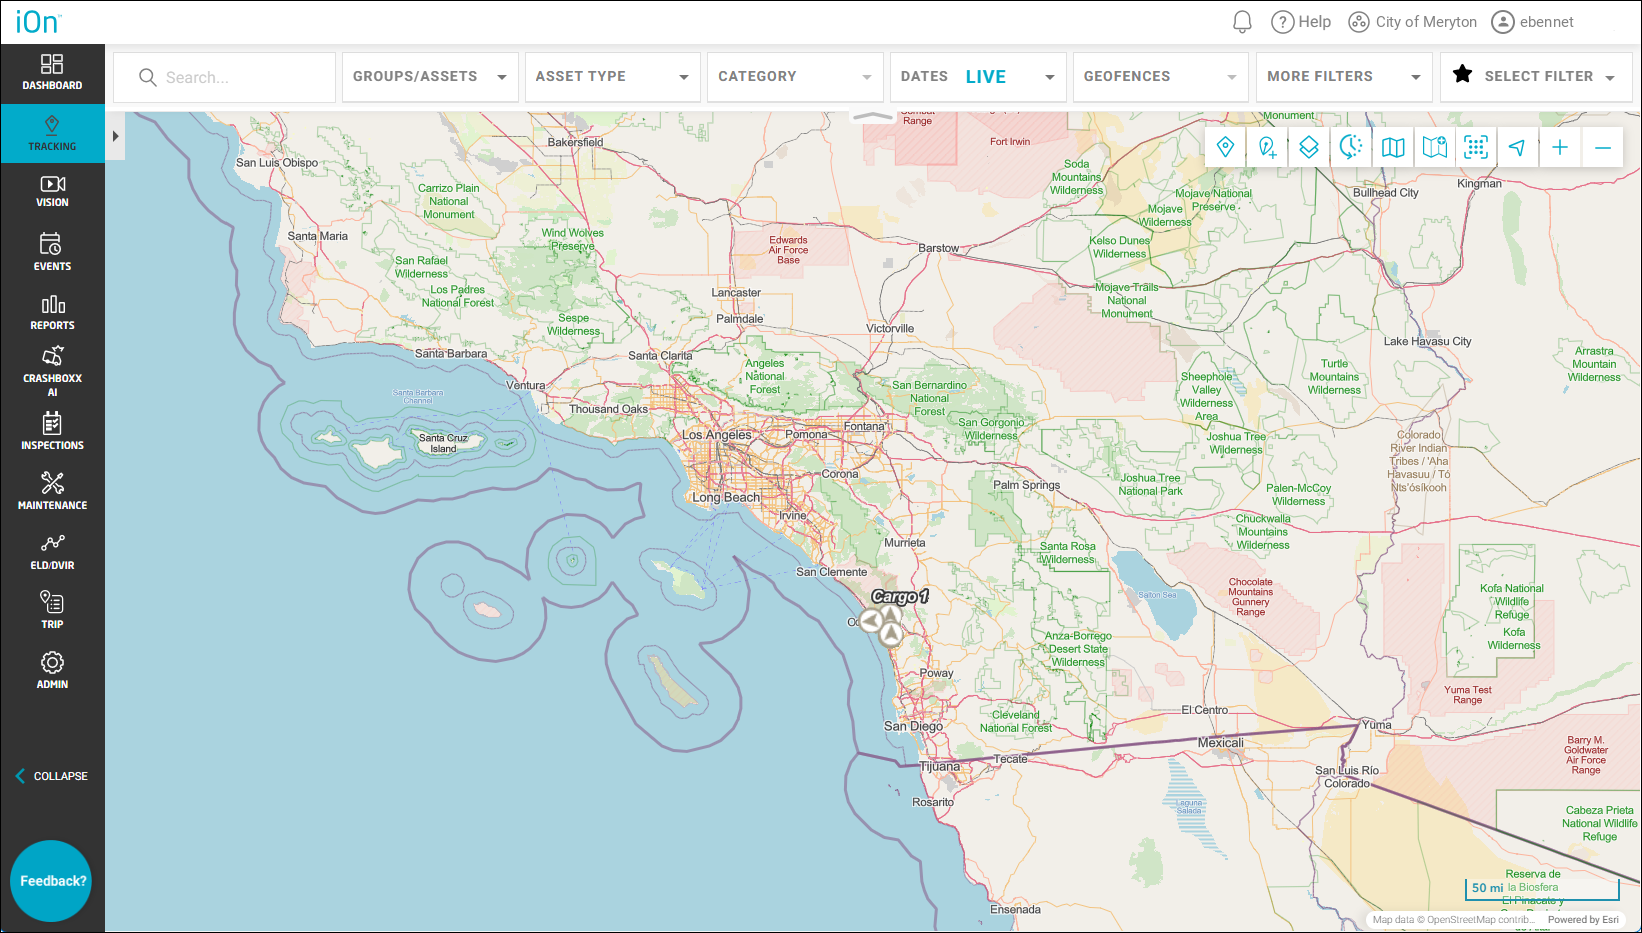
The Tracking screen will open.
By default, it displays the assets and devices of the group you have selected in the Group Chooser on the map. If those are the devices you want to track, you can skip down to here (just after step 3's sublist of steps). (See Choosing a Group to View Globally for details on how to change your chosen group.)

On the new screen, cargo-monitoring devices are now represented by the same icon as other fleet assets ( ).
).
- If you would like to view a different group (or groups), an individual device, or just a few devices, follow these steps:
- Click the Groups/Assets drop-down arrow at the top of the screen.
Your selected group will be displayed (City of Meryton in the example in the following figure). It should be automatically expanded to show its subgroups. (If not, an expansion arrow will appear to the left of its name.)
Note: If you want to view a group above this group, you'll need to change the group you have chosen in the Group Chooser, as shown in Choosing a Group to View Globally. If you want to view a group that is above your assigned group in your account hierarchy, you'll need to obtain different permissions from your organization's iOn administrator.
Note: Include Unlinked SC Devices (if it appears, depending on your account settings) is selected by default, which means that cargo-monitoring devices that aren't associated with an asset but have been added to iOn will also be displayed. If you want to see only devices assigned to an asset, deselect this. - If the group or device you want to view is a subgroup or in a subgroup, click the expansion arrow of its parent group (
 ).
).
If you want to track devices in one or more of their subgroups, click to the left of the higher-level group's name — and keep doing so down the hierarchy until you reach the groups you want.
- To track entire groups, select the groups' check boxes. (
 means selected, and
  deselected.)
To track individual devices, click the More Options ( ) icon under the group they belong to.
The group's devices (and assets) will be displayed.

Then select each device's check box.
Note: You can choose single devices under different groups as well.
Another method of tracking just one device is to perform a search for it by typing part of its ESN (electronic serial number) in the Search field at the top left of the screen and selecting it from the matching entities that will appear in a drop-down list. - Click Done.
- Click the Groups/Assets drop-down arrow at the top of the screen.
- The devices you selected will appear on the map.
Tracking will automatically refresh the map and device data every 12 seconds.
HUGE FLEET MODE: Huge Fleet mode has been removed for the new Tracking screen (which replaced the legacy page in April 2026). So you will have the same options if you are viewing a large number of devices/assets (over 5,000) as you would for viewing a small number, including the ability to turn off clustering (although, of course, performance will be affected).
- If the grid isn't displayed at the bottom of your screen, you can view your devices' data by clicking
 at the top left of the map. (The Tracking screen displays assets and devices in whatever view you last had selected.)
This is how the devices will appear in list view:

- To change the view, mouse over the icon of your current view and then click one of these icons:
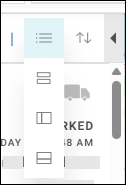
Note: The icon at the top is the one you currently have selected. : Displays the device cards in a list. Each device card will provide some basic details, as follows:
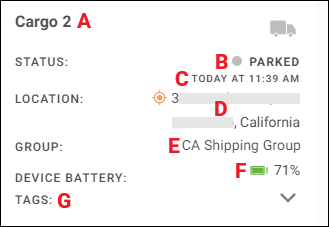
A. The device's name
B. The device's current state (such as Parked)
C. The date and time the device last reported to iOn
D. The address of its current location; if appears by the location, the device currently has a poor GPS signal
E. The group the device is assigned to
F. The current percentage level of the device's battery
G. Its associated iOn Tags (if any), which you can view by clicking the expansion arrow : Displays just the device names and icons in a list.
 : Switches to the details grid and places it to the left of the map. You can click and drag
  to the right to give the grid more screen real estate.

 : Switches to the details grid and places it below the map. You can click and drag
  up to give the grid more screen real estate.
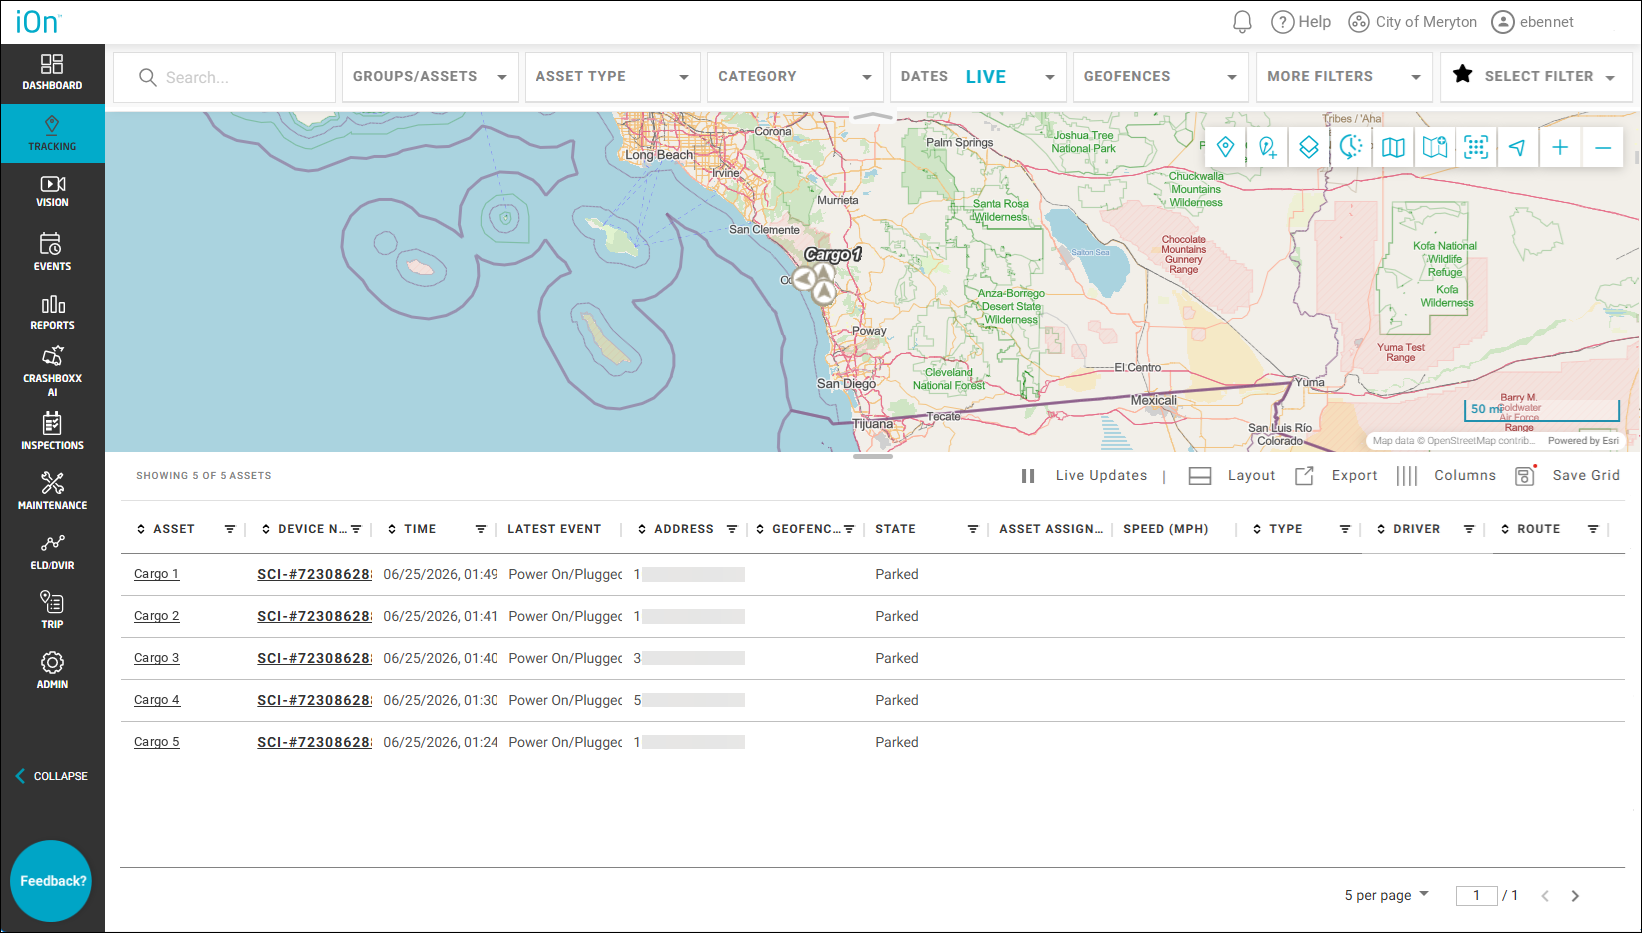
Note: The grid displays details about the selected devices, including where and when each device last reported to iOn.
In the Device Name column, you'll see that each underlined device name is a link you can click to open its Details pane and zoom in on it on the map.
You can export the grid data to a CSV (comma-separated value) file by clicking at the top right of it.
You can add or remove columns by clicking at the top right of the grid and following the steps in Customizing Displayed Columns. If you don't have iOn save grid modifications you make automatically for all the application’s screens (if the Automatically Save Grid Settings toggle in the Preferences area of My Profile is deselected — see Viewing Your Profile and Setting Your Preferences), you can save any layout changes you've made to the grid by clicking
  . (See Saving Grid Changes for an Individual Screen for more details.)
If you apply any filters to the grid, you can clear them all by clicking .
. : Changes the sort order of the device names for the current list view. At first, this will be in ascending order (from lowest to highest for numbers, or from A to Z for words). Clicking the icon will switch to descending order (from highest to lowest for numbers, or from Z to A for words), and another click will return to ascending.
- You can zoom in on a device on the map by clicking in its card in the list view or its name in the grid.
- To view details for a device, click its name on its card in the list or grid view.
The top part of the Details pane contains the same information as the device's card.

You can click to the right of the device's name to open the Edit Device dialog box (if you have Administrator rights), in which you can update the device's properties such as name, group, and status and change its thresholds and reporting rate. (See Editing a Cargo-Monitoring Device for details.)
If the device has iOn Tags associated with it and you click the Tags expansion arrow, they'll appear in a list at the bottom of the pane.

The next few areas of the Details pane provide the following when you click their expansion arrows:
Note: These sections appear only if you have the corresponding sensors, so you might not see all of them. The threshold values in the Details pane are determined by the device's setup and can be changed as shown in Editing a Cargo-Monitoring Device.- Temperature: A graph of the past 24 hours of temperature data, plus the current temperature and the time the reading was reported. On the line graph, the dot will be red if the temperature has gone over the threshold value set by the device configuration.

You can click at the bottom right of the pane to open the graph in a larger window, giving you more screen real estate to examine the data.
- Humidity: A graph of the past 24 hours of humidity data, the current percentage humidity value, and the time the reading was reported.

To see a larger view of the graph, click at the bottom right.
- Light: A graph of the past 24 hours of light readings, with the values in raw lumens, plus the current value and the time the reading was reported. When you mouse over a value on the line graph, the light reading and its time will be displayed. Values over the threshold will be represented by a red dot.

As with the preceding two panes, you can click to launch a larger version of the graph.
- Shock: A graph of the past 24 hours of shock data, with the values in g (the acceleration of gravity). This is designed to enable you to check for a damaging level of applied force to your cargo (the shock value). If this pane displays, "No shock data to display from past 24 hours," that's good news because it means that the device wasn't hit with any impacts above the threshold value you specified. If any value appears on the graph, it will be listed in red, as this indicates a force level breach, and the area that was affected will be shown (such as "Top/Side"). The value at the top right is the most recent value.

- Tilt: A drawing depicting either tilted or upright (reflecting the latest status of the cargo); the last four reported tilt readings, with the most recent one on top; and the current degrees of tilt. If the status is below the Tilt threshold you set for the device, the current value will have a blue arrow pointing up beside it (
 ); if the reading is above that threshold, there will be a red curved arrow next to it (
 ).
).

- Additional Info: Device properties such as name, device type, ESN, and status.

- Temperature: A graph of the past 24 hours of temperature data, plus the current temperature and the time the reading was reported. On the line graph, the dot will be red if the temperature has gone over the threshold value set by the device configuration.
- To view a device's pop-up window, click its icon on the map.

This displays the device's current status (such as Parked or Moving), its battery level, its name, the date and time it last reported to iOn, and its current location. If appears by the location, the device currently has a poor GPS signal.
On the right, you'll find these icons, which link to these actions:
 : Loads the Gateway History report, which will map the history of events for the device. (See Mapping Cargo-Monitoring Device History for details.)
 : Pops up the Find Nearby dialog box, which enables you to find fleet assets that are close to the device.
 : Launches Google Maps and plots directions from your current location to the device.
 : Opens Street View in Google Maps for the device's location.