The Dashboard provides key information about your fleet's overall performance in an at-a-glance view. The Safety Dashboard has charts and graphs that show your harsh event safety violations by type, your total number of harsh events from month to month, your overall fleet safety score, how many harsh events each driver has triggered, and driver score card data.
Note: This may be labeled "Safety Basic" for you, depending on your user role. The data you will see is almost exactly the same as what is shown below. This Dashboard was created for Vision customers with roles that can't view their videos; it displays all the information but not links to video captures.
By default, the Safety Dashboard displays results for the last seven days for all your groups, all your drivers, all your assets, and all event types. To see how to change these options, go to Customizing What's Displayed on the Safety/Safety Basic Dashboard.
Displaying the Safety Dashboard
To open the Safety Dashboard, follow these steps:
- On the sidebar menu on the left, click
 .
.
- On the flyout menu that appears, click Fleet.
The Dashboard screen will appear and display the Devices tab, unless you were on one of the other tabs previously during this session.
- Click the Safety tab at the top of the screen.
Note: Click the Safety Basic tab if that's what you see to the right of the Devices tab. (See the Note at the top of the article.)
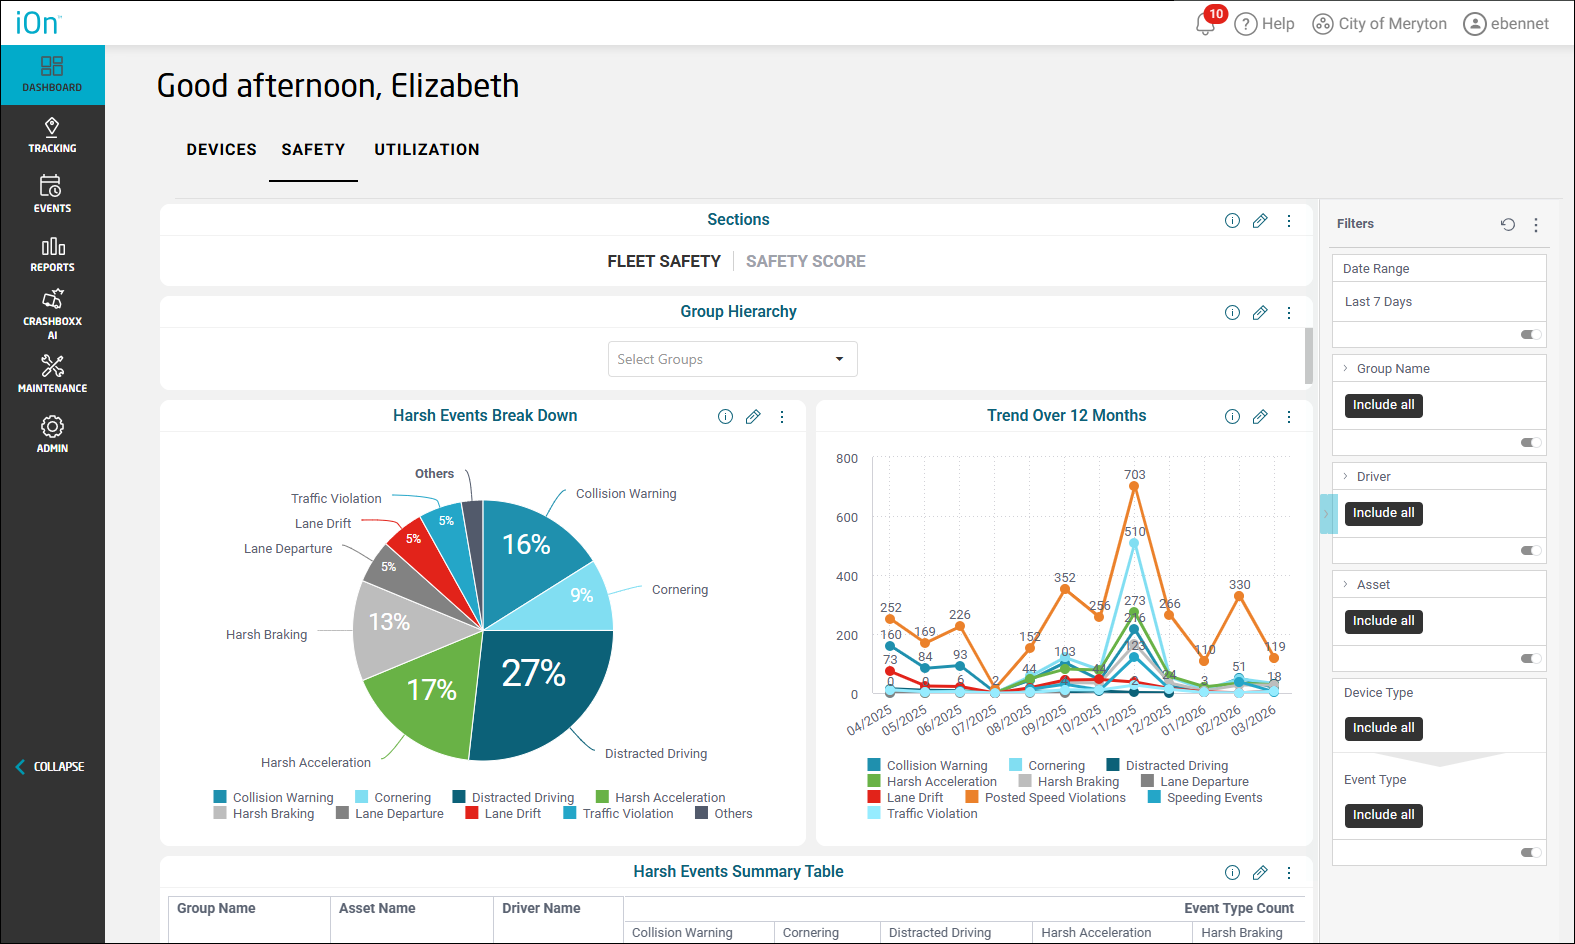
The Fleet Safety section of the Safety Dashboard will be displayed.
Note: The Group Hierarchy tile enables you to change the group(s) whose data is being displayed. Go to Customizing What's Displayed on the Safety/Safety Basic Dashboard for details.
Note: You can give the Dashboard widgets more screen real estate by collapsing the Filters pane on the right by clicking . You'll find this about halfway down the screen between the tiles and the Filters pane. (Click
  to restore the filters to view.)
 - In the Sections area at the top, click Safety Score for driver safety score data.
The Safety Score section will appear.

- At the top right of each widget are three icons, which you can click for the following:

 : Provides a description of the tile's data.
 : Opens the edit options for the tile (if any). See Customizing What's Displayed on the Safety/Safety Basic Dashboard for details.
 : Offers options to rename the widget and to download it as an image or a CSV (comma-separated value) file.
The Fleet Safety Tiles
The Harsh Events Break Down Widget
The Harsh Events Break Down tile contains a pie chart with the percentages of harsh event safety violations by type, such as Collision Warning, Cornering, and Distracted Driving. Each pie slice shows both the percentage of a violation type and the number of occurrences of that event over the course of the time period (when you mouse over it). The events are color-coded by type, with the legend underneath the pie chart. You can click a category in the legend to have it removed from the chart.

The Trend Over 12 Months Widget
The lines of the Trend Over 12 Months graph represent the total number of each harsh event type from month to month for the last 12 months, so you can see how the violations are trending over the past year. Again, the harsh events are color-coded, with an explanatory legend below the line graph. You can click a category in the legend to have its data removed from the chart.

The Harsh Events Summary Table Widget
The Harsh Events Summary Table tile lists your drivers by name and displays the count of each harsh event they are responsible for over the course of the chosen time frame on each asset they drove, organized by group.

The Safety Score Tiles
The Fleet Score and Active Drivers Widgets
At the top of the Safety Score section, you will see your fleet's overall safety score, which is calculated using the number of safety violations over the course of the chosen time range incurred by all your drivers (by default). (Again, you can modify the time period and applicable drivers as shown in the article Customizing What's Displayed on the Safety/Safety Basic Dashboard.) To the right of the Fleet Score widget is Active Drivers, which shows the number of drivers the data is reflecting.

The Driver Score Card Summary Widget
On the Driver Score Card Summary tile is a grid of driver score card data, with each driver and asset separated by their assigned group, including driver scores, the number of days they were active for the date range, their travel time, idle time, distance driven, speeding events, and maximum speed. Make sure that you scroll to the right to show the columns you can't see at first.

The Driver Score Monthly Breakdown Widget
The Driver Score Card Monthly Breakdown tile contains a table with month-to-month driver scores for the last six months. Each column on the right is one month's score. Make sure that you scroll all the way right to see all the months.

The Driver Score Trend Over Time Widget
The Driver Score Trend Over Time tile has a line graph showing your overall driver scores from month to month for the last six months, so you can see how the scores have gone up and down recently. You can mouse over a point to see its value.

You can click  above the graph to view Trend options.